- Crowne Point News
- Posts
- Un-Presidenteded
Un-Presidenteded
Preserving Your 401k In Uncertain Times

Kamala’s fundraising and meme game came out strong this week, still to be seen if she can keep this momentum up for the next 100 days
Welp. That week was…wow.
I don’t know about you, but the timeline shift from 2019 has truly been wild. Like Twin Peaks wild. I’ll prove it to you: Joe Biden dropped out of the race seven days ago; and you can’t tell me it doesn’t feel like that was a year ago. The issue with these wild times is that they are completely unpredictable. And if there is one thing markets - and your 401k - hates it is uncertainty.
In law school, a professor once told me “the best attorneys can see around corners.” And in my (too many) years of practice, I’ve found that to be absolutely correct. When you’re dealing with someone else’s livelihood, they want to know you’re looking out for them - which means you need to be wary of what could go wrong, and make sure you’re prepared. But how is that possible when investing in markets?
The Inconceivable Nature of Nature
In discussing energy waves and the electromagnetic field the late great Richard Feynman explained that energy is all around us - but we don’t truly understand that concept until we, for example, turn on a radio to translate that energy to sound. “But you gotta stop and think about it,” he extolled “to really get the pleasure about the complexity the inconceivable nature…of nature.”
And that’s true of markets too: you really got to stop and think about it to get the pleasure in the uncertainty, the volatility, the unknowns - it’s really interesting. But how to think about to maximize our pleasure when investing while minimizing the pain? I’d argue we think about it as a range of outcomes:
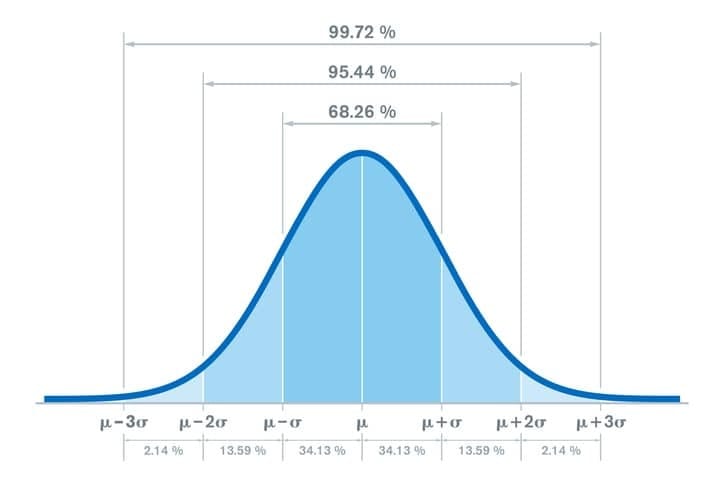
One way to visualize risk: Investments that are the most risky will swing between ±3 sigma (standard deviation) from the mean, making investment performance harder to predict. Sure less risk, less returns, but the less I lose the less ground I have to make up to get back to square one.
The “risk” in investing is in the sigma (as in, “what the sigma” for those of you with middle schoolers in the house) which represents standard deviation. Typically events repeated over time revert to results around a mean. For example, in school we would flip a coin over and over and found that the outcome of all those events events out ½ tails, ½ heads, on average. With investing, we want to reduce the standard deviation - said another way, we want to reduce the range of possible outcomes so that they cluster closely around the mean. If we know where the mean typically is, then we can better predict our outcomes.
Modern Portfolio Theory tells us that the best way to do that is diversification. The thinking goes: if we hold assets that are not correlated and not subject to the same risk of loss, then we narrow the range of outcomes, making our bell curve taller and our investing lives a little more predictable.
And after the rollercoaster of this week, I think we can all use a little predictability - and maybe a cocktail. Now, let’s look ahead to what’s on tap next week:
Earnings and Economic Data
This week we get information on the labor market, an FOMC meeting, and massive earnings reports.
In the early part of the week we get a gauge and the level of demand in the labor market and at the end of the week we get data on the supply of workers; how many are already employed and how much are they really making.
In between, earnings season kicks into high gear with McDonald’s, Meta, Amazon, Apple, and Microsoft all reporting - those five companies make up about 22% of the market capitalization of the S&P. With these names being such a huge part of the market, any move in price after their earnings report will likely move the entire S&P. On top of all of this, we have a highly anticipated FOMC meeting. So it’s setting up to be a wild week - which means we should be prepared for the unpredictable by arming ourselves with information.
Labor Demand. The Jon Openings Labor Turnover Survey( a.k.a the JOLTS report) on Tuesday will give us insight on the level of demand amongst businesses for workers. The more jobs openings there are that go unfilled, the higher the demand for workers. And as we know, higher demand means higher prices; in this case it’s the price businesses have to pay to attract workers - e.g. larger salaries. Thing is, if people are making more, then they have more money which in turn prompts businesses to increase prices, which is a driver of inflation. And we can see that in the chart below, which plots the JOLTS and core inflation over the last three years. Notice the years when the JOLTS numbers were high, inflation was also high. Analysts are looking for the JOLTS report to come in at about 7.975 million jobs. Watch for a number above or below that expectation to get a sense for how the market might react. Higher than 7.975 means demand for jobs is high and employers need to pay better to fill those jobs; lower than that expectation likely indicates a continued cooling of inflation.
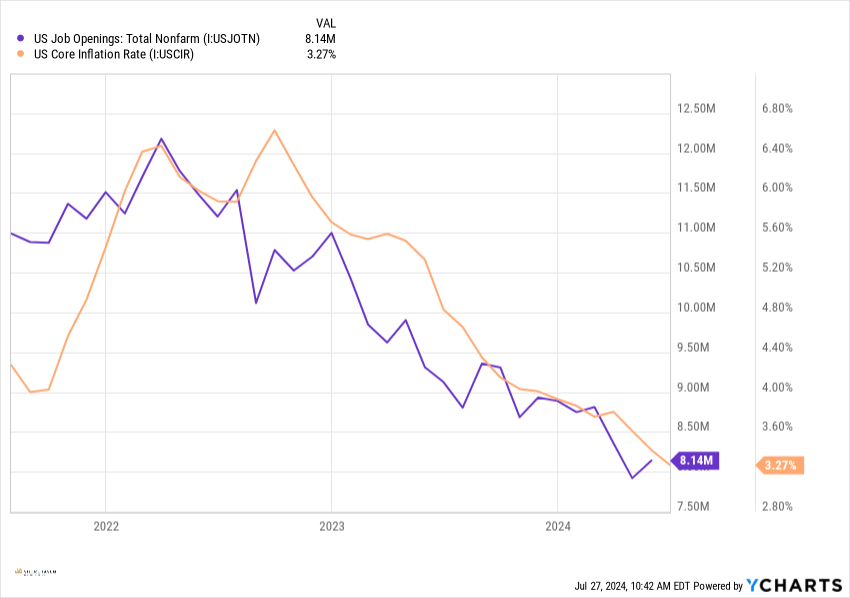
As the number of job openings increase, so goes inflation.
Labor Supply. On Friday we get the other component of the labor market, supply. NonFarm Payrolls measures the number of workers on the payroll in any business that employs people except those who are, farm employees private household employees Employees of certain nonprofit organizations, and general government employees. Typically when the supply of workers is high (they are not employed currently) businesses can pay lower wages to attract those workers. That’s what we want as we continue to battle inflation, as agin we see from the chart where the orange line shows us the drop in inflation in relation to labor supply. Analysts expect the number to be about 185,000 jobs added in the last month. If we’re above that number it likely shows a very strong labor market, a tightening supply of available workers, which means higher wages are likely - further contributing to inflation. It would probably be nice to see a number at or below forecasts as the Fed prepares to cut interest rates.
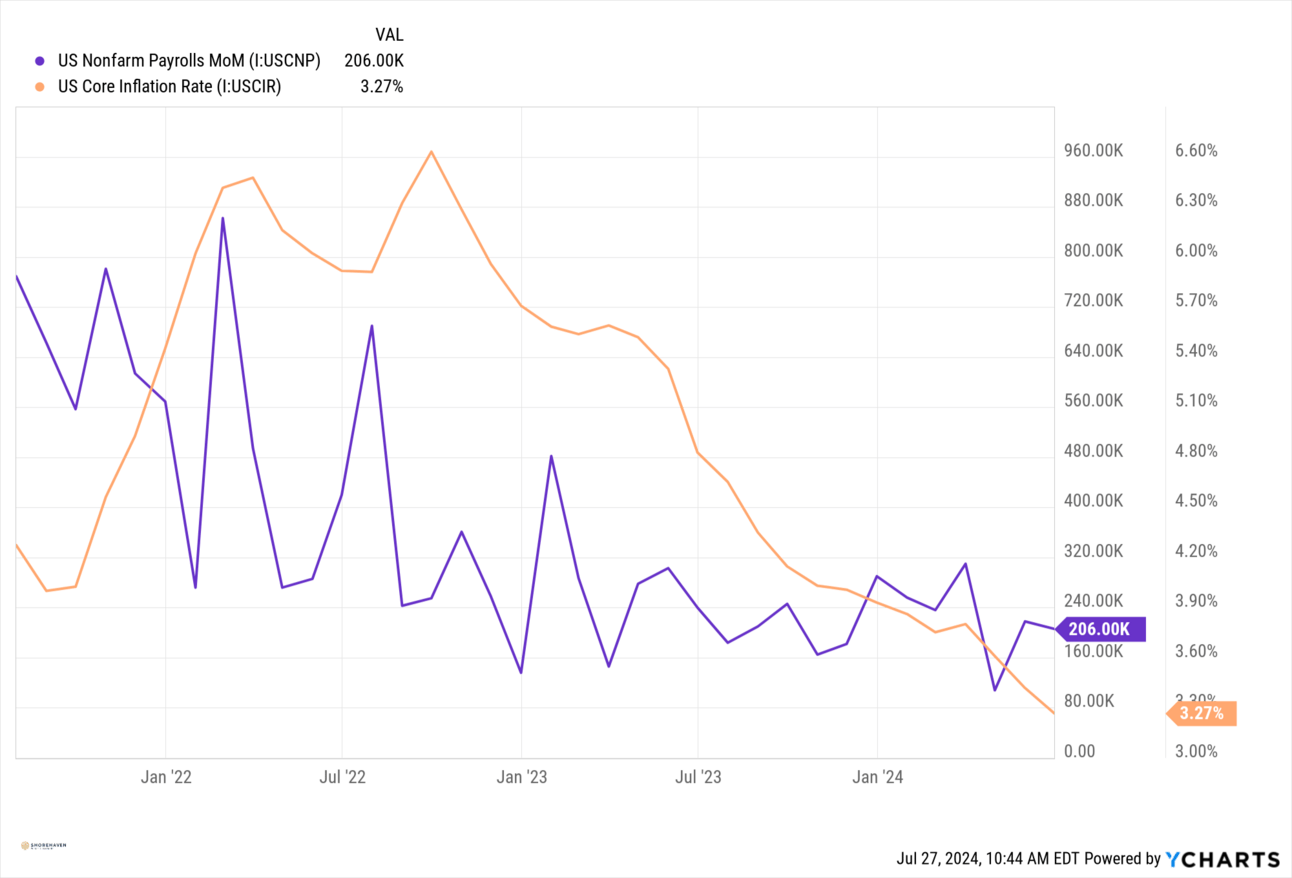
The supply of labor have been quite volatile, let’s see if we can’t start a downward trend this week.
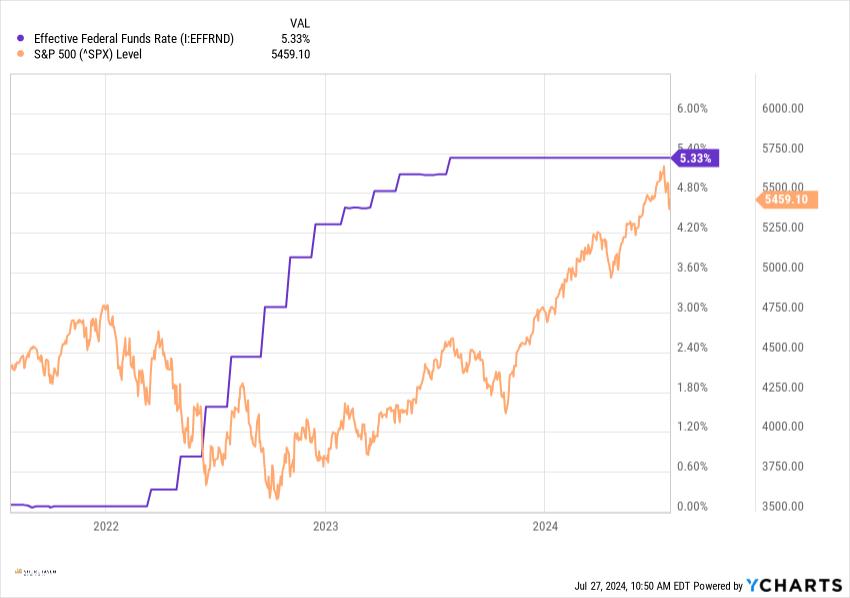
All Eyes On JPow. The Federal Reserve Open Markets Committee will meet this week on July 30 and 31st. This is probably the most hotly anticipated event of the year - bigger than Taylor Swift even (okay, that’s just ridiculous). But seriously, lately the market has been hanging on every word of Jerome Powell’s press conference during these meetings. The expectation is for them to hold rates steady, but strongly signal that they will be cutting rates in September. But who knows, we could be surprised with a Christmas-in-July style rate cut surprise. The chart below shows just how much the market values certainty. We can see as the Fed (purple line) tightened up on rates, the market got spooked - not likely the uncertainty of when the pain of higher rates would end. But then when things stabilized, the market had a party. It remains to be seen if the exuberance continues during the upcoming rate cut cycle, but many are predicting that there may be a short term pull back as we inject a different kind of uncertainty in the market.
Movers and Shakers. This is an absolutely giant week for earnings. McDonald’s Big Tech: Meta, Amazon, Apple, and Microsoft all report this week. McDonald’s is an interesting story after they got shredded online for a $18 Big Mac Meal prompting a flurry of fast food companies to offer deals and slash prices. (Not a good look to defend the high price of fast food claiming it merely outpaced inflation, but didn’t double in price). We’ll get a glimpse at what that does to their bottom line. Plus, the big hairy monsters of the market report - Amazon, Microsoft, Apple, and Meta.
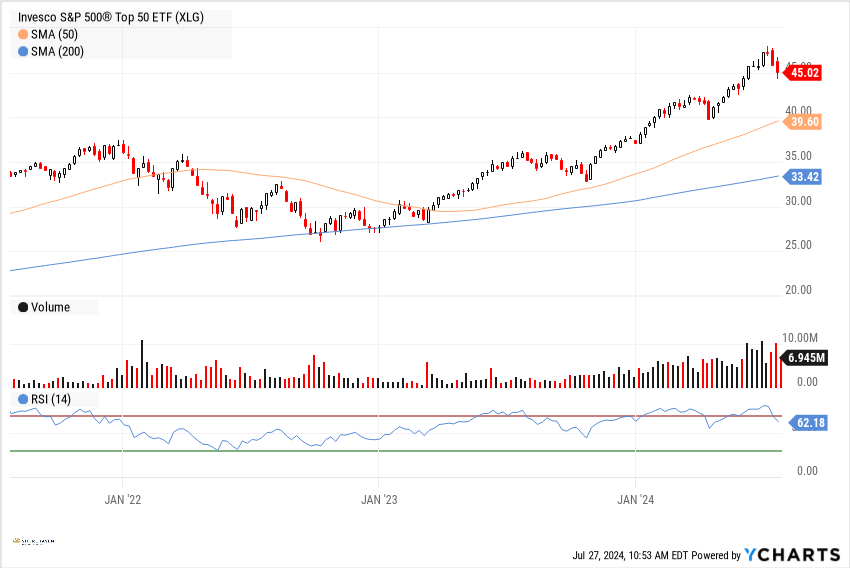
One thing I’d like to point with the chart below is that you can actually get a diversified (read: less risky) position in all of these names: NVDIA, Microsoft, Amazon, Apple, Meta, and more by putting money into an Exchange Traded Fund. An Exchange-Traded Fund (ETF)works by pooling investors' money to purchase a diversified portfolio of assets, such as stocks or bonds, which is traded on an exchange like a single stock, allowing for easy buying and selling throughout the trading day. This provides tax, liquidity, and risk advantages over simply buying each of these individual names. But don’t take my word for it: have a look at the chart below and hear it from the Oracle himself.
